Bump Chart
Using a Bump chart, you can compare the position, performance or rankings of multiple observations rather than the actual values
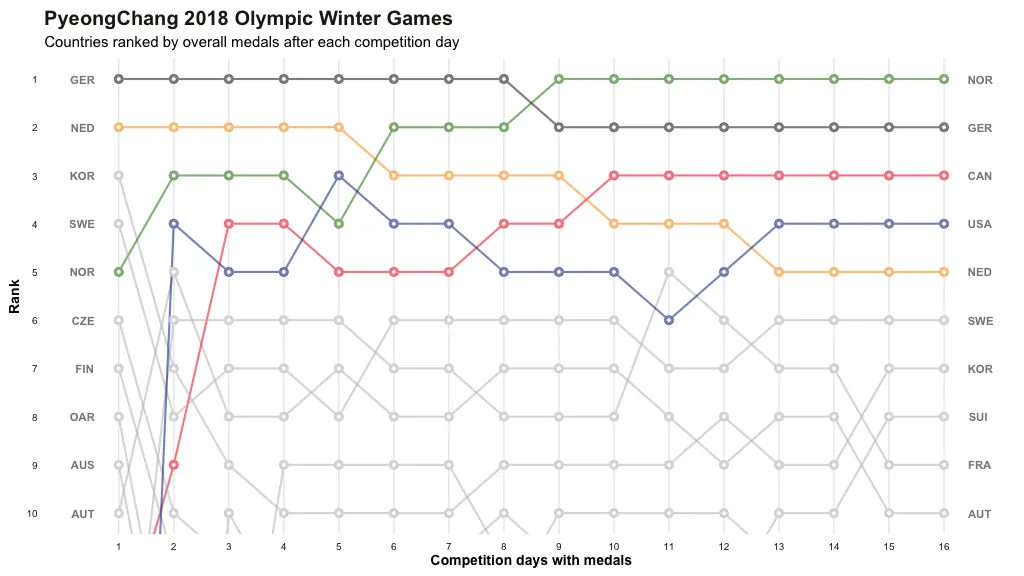
A Bump Chart is a special form of a line plot. This chart is well-suited for exploring changes in rank over time. Using this chart, you can easily compare the position, performance or rankings of multiple observations with respect to each other rather than the actual values itself.
These charts are relatively similar to line charts. However, instead of plotting some measures on the y-axis, these charts show the rank. Bump charts have been around for a while, but recently there is an increased interest in these charts. The name originated from a boat race where each boat tries to bump their boat and move up in their respective standing. Bump charts are very useful to compactly highlight trends.
Interpreting a Bump Chart
When a line crosses another line, that is indicative of a change in rank. In other words, a crisscross in a bump chart indicates one entity has surpassed other in absolute terms even when comparison is based on relative ranks. Rank is a powerful feature for any visualization. It is very effective to understand how each of the categorical members perform against the same measure.
When to use this chart?
Ultimately, you could use Bump charts to communicate changes in ranks amongst your dimensions. Likewise, if you wish to show the magnitude and relationships among your dimensions, you can use these charts. If rank is very important, then a Bump chart is the better option. However, if actual and relative magnitudes are more important, then you are better off with a different type of visualisation, such as a line or area chart. In situations where both are important, a sized bump chart is better suited. In practise, you can use a Bump chart can be used to visualise data from social media sources to identify trending topics.
Credits
The source code from R-Bloggers was used to create the visualisation.
Written by

Mithun Sridharan
Founder, LinkPress™
Mithun is a strategist, advisor, educator, and speaker focused on helping leaders make better decisions in environments shaped by change, complexity, and emerging technology. His work brings together leadership, management consulting, digital transformation, and artificial intelligence in a way that is practical, grounded, and commercially relevant.
Related Posts
Data Visualization
Data Visualization is the most elegant way to connect data analysts & end-users by visually presenting complex analyses & insights
Mithun Sridharan History Of Data Visualization
We live in an exciting yet challenging time for data visualization. As we enter the information age, it's both exciting and terrifying to imagine what the future holds in store for us
Mithun Sridharan Data Literacy Empowers Academic Writing
Elevating student research performance through evidence
Mithun Sridharan